Nirvana Neuro Science

NIRVANA-NEUROSCIENCE

OUR SERVICES & APPLICATIONS

Our Mission:
Excellence in Collaborative Contract Research
Without Compromise

Hippocampal CA3 neuron

Cortical Pyramid

WHAT WE DO:

JUST SEND US FIXED BRAINS…We do everything else !
Using the formalin fixed brain tissue sent to our lab, Nirvana Neuroscience
specializes in:
Golgi-impregnation staining of neurons and preparation of coded slides followed by highly computerized and AI-assisted microscopic
analyses of :
Dendritic Branching — provides measures of dendritic lengths and domain complexity.
Dendritic Spines — computerized counting and categorizing of dendritic spines of the Golgi impregnated neurons.
Our Stereology Services provide unbiased estimates of the number of neurons and volume of a defined brain region. Stereology used as an adjunct procedure to the Golgi studies can provide significant insight into the relevance of the Golgi data. This is available upon request.

All neuronal and dendritic analyses are carried out on coded slides using the latest computer- and AI-assisted software and hardware to mitigate human error and biases.

In addition to intermediate updates of the status of the study, a final report will include a complete statistical analysis with appropriate graphics, photomicrographs, and a discussion of the results.

HERE ARE SOME SCENARIOS FOR APPLICATION OF OUR SERVICES

  1. Animal Models of Brain Aging and Alzheimer’s Disease: assessing the efficacy of putative prophylactic or therapeutic treatment strategies on the health and integrity of neural circuitry
  2. Transgenic and Knockout Mouse Models
  3. Traumatic brain injury/CTE/Concussion-related brain injury
  4. Dietary manipulation of brain development and aging
  5. Extrinsic environmental or intrinsic genetic factors influencing brain development, maturation, and aging
  6. Effects of putative neurotoxins
  7. Effects of pharmaceuticals on learning and memory

HERE ARE A FEW EXAMPLES OF OUR ANALYSES

DENDRITIC BRANCHING ANALYSIS
Dendritic branching analysis data includes:

1. Estimated total dendritic length,
2. Distribution of the dendritic arbor,
3. Complexity of the dendritic tree.
4. soma size

Evaluating the Amount of Dendritic Branching from Golgi-Stained Neurons.

Example 1: Dendritic Alterations in an Animal Model of Alzheimer’s Disease.

(Below --Photomicrograph of a hippocampal CA1 pyramid from a wild type control mouse )

(Below --Photomicrograph of a hippocampal CA1 pyramid from a wild type control mouse )

Below: CA1 basilar trees from normal wild type mouse (above) and from a mouse model of Alzheimer’s Disease (below), a transgenic Arc A-beta mouse.

Comparison of the complexity of the dendritic fields of the CA1s also shows reduction of complexity in this mouse model of AD

The graph above compares the complexity of CA1 basilar dendritic trees from 3 month-old wild type control mice (blue) vs CA1s from an age-matched Arc A-beta mouse model of AD (red). The neurons from the AD mouse model have significantly fewer branch points than the WT controls; as such, the dendritic arbor of the AD mouse CA1s is less complex.

Example 2: Environmental/Dietary Studies --

A Blueberry-Enriched Diet Reverses Age-related Neocortical Dendritic Branch Loss in Old Rats

The graph above shows how dietary ingredients can influence dendritic branching – in this case, the effects of a blueberry enriched diet on age-related changes of neurons in the rat neocortex. The Sholl graph below demonstrates that there is a significant decrease in dendritic branching with normal aging (young control profile [top] vs. the old control [bottom]). Treatment of older rats with a blueberry-enriched diet for 3 months increased the amount of the dendritic branching in the cortical pyramids (middle profile) such that it was now not significantly less than in the young mice. This shows that normal age-related loss of the dendritic arbor can be ameliorated by dietary means, thus maintaining the more youthful brain circuitry.

Representative photomicrographs of layer II/III pyramids of the parietal cortex (basilar tree) from an old control rat (left) and from an old age-matched rat which had received a blueberry enriched diet (right).

Example 3: Neurotoxicology Studies

Neonatal exposure to PCBs results in reduced dendritic arbor in hippocampal CA1s of 22 do rat pups.

Neonatal Exposure to PCBs results in early – but reversible – damage to Purkinje Cells of the Cerebellum of the Rat

Appearance of Golgi stained Purkinje cells in Rat Cerebellum

  1. Measurement of area of representative Purkinje Cell dendritic arbor (22 days-old). B. Purkinje cell arbor of 22 day-old rats exposed to PCB is significantly smaller than age-matched controls. C.  Dendritic arbor of Purkinje cell from adult (60 day-old) rat cerebellum.  D. Purkinje cell dendritic arbor of 60 day old rat which had been exposed neonatally to PCBs.

Example 4. Neuropathology. Normal appearing hippocampal CA1 from non-cognitively impaired 80 year old.

  1. Measurement of area of representative Purkinje Cell dendritic arbor (22 days-old). B. Purkinje cell arbor of 22 day-old rats exposed to PCB is significantly smaller than age-matched controls. C.  Dendritic arbor of Purkinje cell from adult (60 day-old) rat cerebellum.  D. Purkinje cell dendritic arbor of 60 day old rat which had been exposed neonatally to PCBs.

Atrophic CA1 pyramid seen in autopsied hippocampal tissue from Alzheimer brain (86 years old).

SPINE ANALYSIS

Our Dendritic Spine Analysis Studies include assessment of:
  • Spine Density
  • Spine Configurations
Example 1:  Reduction of Dendritic Spines in Hyperglycemic Rats
The graph below shows the spine density on granule cells of the rat dentate gyrus.
Hyperglycemic rats show significant spine loss compared to controls and hypoglycemic ra

The photomicrographs below show the appearance of spines from controls and hyperglycemic rats:

Example 2: Loss of Dendritic Spines in the Progression of Alzheimer’s Disease Normal appearing hippocampal CA1 from non-cognitively impaired 80 year old.

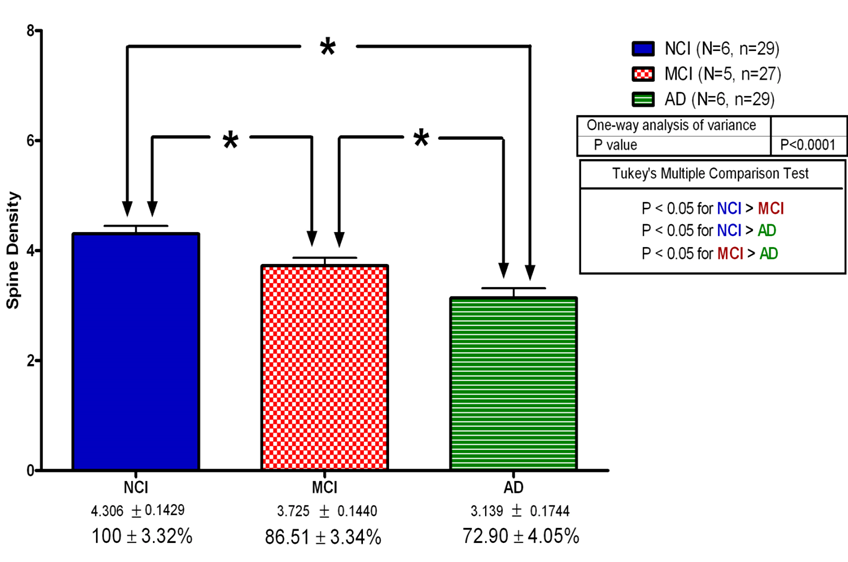
Normal Aging (Non-Cognitively Impaired

Mild Cognitive Impairment (MCI)

Alzheimer’s Disease

The impact of the progression of AD on dendritic spines in the temporal cortex is summarized in the accompanying graph (below)

Progressive Spine Loss in the Evolution of Alzheimer’s Disease

Example 3: Extrinsic Influences on Dendritic Spine

CA1 pyramids: loss of M-type spines (% change from control)

Example 4: Traumatic Brain Injury

Example 5. Cerebral Ischemia

Appearance of dysmorphic dendritic spines in penumbra of an animal model of middle cerebral arterial occlusion (MCAO).
Note the appearance of numerous long filopodia-like spines.

The above graphs and photomicrographs provide illustrations of the diverse scope of studies with which Nirvana Neuroscience has been involved.

Scroll to Top